


Cortland County, New York
About
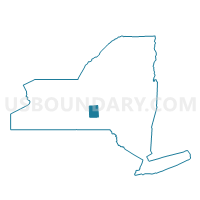
Outline

Summary
| Unique Area Identifier | 120268 |
| Name | Cortland County |
| State | New York |
| Area (square miles) | 501.52 |
| Land Area (square miles) | 498.76 |
| Water Area (square miles) | 2.76 |
| % of Land Area | 99.45 |
| % of Water Area | 0.55 |
| Latitude of the Internal Point | 42.59382370 |
| Longtitude of the Internal Point | -76.07626470 |
| Total Population | 49,336 |
| Total Housing Units | 20,577 |
| Total Households | 18,671 |
| Median Age | 35.8 |
Maps
Graphs
Select a template below for downloading or customizing gragh for Cortland County, New York


Neighbors
Neighoring County (by Name) Neighboring County on the Map
- Broome County, NY
- Cayuga County, NY
- Chenango County, NY
- Madison County, NY
- Onondaga County, NY
- Tioga County, NY
- Tompkins County, NY
County Subdivision in Cortland County (by Name) Neighboring County Subdivision on the Map
- Cincinnatus town, Cortland County, NY
- Cortland city, Cortland County, NY
- Cortlandville town, Cortland County, NY
- Cuyler town, Cortland County, NY
- Freetown town, Cortland County, NY
- Harford town, Cortland County, NY
- Homer town, Cortland County, NY
- Lapeer town, Cortland County, NY
- Marathon town, Cortland County, NY
- Preble town, Cortland County, NY
- Scott town, Cortland County, NY
- Solon town, Cortland County, NY
- Taylor town, Cortland County, NY
- Truxton town, Cortland County, NY
- Virgil town, Cortland County, NY
- Willet town, Cortland County, NY
Top 10 Neighboring Place (by Population) Neighboring Place on the Map
- Cortland city, NY (19,204)
- Homer village, NY (3,291)
- Munsons Corners CDP, NY (2,728)
- Cortland West CDP, NY (1,356)
- McGraw village, NY (1,053)
- Marathon village, NY (919)
- DeRuyter village, NY (558)
- Blodgett Mills CDP, NY (303)
Top 10 Neighboring Unified School District (by Population) Neighboring Unified School District on the Map
- Cortland City School District, NY (24,558)
- Dryden Central School District, NY (13,012)
- Homer Central School District, NY (12,531)
- Whitney Point Central School District, NY (9,080)
- Newark Valley Central School District, NY (7,784)
- Moravia Central School District, NY (7,584)
- Greene Central School District, NY (6,971)
- Groton Central School District, NY (6,024)
- Tully Central School District, NY (5,968)
- Fabius-Pompey Central School District, NY (4,821)
Top 10 Neighboring State Legislative District Lower Chamber (by Population) Neighboring State Legislative District Lower Chamber on the Map
- Assembly District 111, NY (132,613)
- Assembly District 125, NY (131,678)
- Assembly District 129, NY (130,747)
- Assembly District 107, NY (125,994)
- Assembly District 123, NY (124,261)
Top 10 Neighboring State Legislative District Upper Chamber (by Population) Neighboring State Legislative District Upper Chamber on the Map
- State Senate District 54, NY (302,881)
- State Senate District 49, NY (296,854)
- State Senate District 51, NY (296,420)
- State Senate District 52, NY (290,862)
Top 10 Neighboring 111th Congressional District (by Population) Neighboring 111th Congressional District on the Map
- Congressional District 25, NY (668,869)
- Congressional District 23, NY (664,245)
- Congressional District 24, NY (657,222)
Top 10 Census Tract in Cortland County (by Population) Neighboring Census Tract on the Map
- Census Tract 9702, Cortland County, NY (5,830)
- Census Tract 9710, Cortland County, NY (5,537)
- Census Tract 9709, Cortland County, NY (4,910)
- Census Tract 9711, Cortland County, NY (4,823)
- Census Tract 9707, Cortland County, NY (4,590)
- Census Tract 9712, Cortland County, NY (4,111)
- Census Tract 9705, Cortland County, NY (3,862)
- Census Tract 9701, Cortland County, NY (3,715)
- Census Tract 9703, Cortland County, NY (3,144)
- Census Tract 9706, Cortland County, NY (3,125)
Top 10 Neighboring 5-Digit ZIP Code Tabulation Area (by Population) Neighboring 5-Digit ZIP Code Tabulation Area on the Map
- 13045, NY (30,112)
- 13077, NY (6,735)
- 13073, NY (6,423)
- 13118, NY (6,382)
- 13778, NY (5,948)
- 13068, NY (5,368)
- 13159, NY (5,184)
- 13053, NY (5,015)
- 13862, NY (4,189)
- 13803, NY (3,975)
Data
Demographic, Population, Households, and Housing Units
** Data sources from census 2010 **
Show Data on Map
Download Full List as CSV
Download Quick Sheet as CSV
| Subject | This Area | New York | National |
|---|---|---|---|
| POPULATION | |||
| Total Population Map | 49,336 | 19,378,102 | 308,745,538 |
| POPULATION, HISPANIC OR LATINO ORIGIN | |||
| Not Hispanic or Latino Map | 48,242 | 15,961,180 | 258,267,944 |
| Hispanic or Latino Map | 1,094 | 3,416,922 | 50,477,594 |
| POPULATION, RACE | |||
| White alone Map | 46,901 | 12,740,974 | 223,553,265 |
| Black or African American alone Map | 760 | 3,073,800 | 38,929,319 |
| American Indian and Alaska Native alone Map | 137 | 106,906 | 2,932,248 |
| Asian alone Map | 416 | 1,420,244 | 14,674,252 |
| Native Hawaiian and Other Pacific Islander alone Map | 5 | 8,766 | 540,013 |
| Some Other Race alone Map | 271 | 1,441,563 | 19,107,368 |
| Two or More Races Map | 846 | 585,849 | 9,009,073 |
| POPULATION, SEX | |||
| Male Map | 24,093 | 9,377,147 | 151,781,326 |
| Female Map | 25,243 | 10,000,955 | 156,964,212 |
| POPULATION, AGE (18 YEARS) | |||
| 18 years and over Map | 38,925 | 15,053,173 | 234,564,071 |
| Under 18 years | 10,411 | 4,324,929 | 74,181,467 |
| POPULATION, AGE | |||
| Under 5 years | 2,711 | 1,155,822 | 20,201,362 |
| 5 to 9 years | 2,789 | 1,163,955 | 20,348,657 |
| 10 to 14 years | 2,979 | 1,211,456 | 20,677,194 |
| 15 to 17 years | 1,932 | 793,696 | 12,954,254 |
| 18 and 19 years | 2,808 | 572,582 | 9,086,089 |
| 20 years | 1,652 | 293,083 | 4,519,129 |
| 21 years | 1,554 | 281,596 | 4,354,294 |
| 22 to 24 years | 2,574 | 836,256 | 12,712,576 |
| 25 to 29 years | 2,712 | 1,380,177 | 21,101,849 |
| 30 to 34 years | 2,537 | 1,279,160 | 19,962,099 |
| 35 to 39 years | 2,644 | 1,254,124 | 20,179,642 |
| 40 to 44 years | 2,991 | 1,355,893 | 20,890,964 |
| 45 to 49 years | 3,570 | 1,458,763 | 22,708,591 |
| 50 to 54 years | 3,474 | 1,419,928 | 22,298,125 |
| 55 to 59 years | 3,163 | 1,237,408 | 19,664,805 |
| 60 and 61 years | 1,175 | 453,993 | 7,113,727 |
| 62 to 64 years | 1,613 | 612,267 | 9,704,197 |
| 65 and 66 years | 844 | 330,160 | 5,319,902 |
| 67 to 69 years | 1,138 | 443,051 | 7,115,361 |
| 70 to 74 years | 1,478 | 587,391 | 9,278,166 |
| 75 to 79 years | 1,152 | 474,807 | 7,317,795 |
| 80 to 84 years | 901 | 391,660 | 5,743,327 |
| 85 years and over | 945 | 390,874 | 5,493,433 |
| MEDIAN AGE BY SEX | |||
| Both sexes Map | 35.80 | 38.00 | 37.20 |
| Male Map | 35.30 | 36.30 | 35.80 |
| Female Map | 36.40 | 39.40 | 38.50 |
| HOUSEHOLDS | |||
| Total Households Map | 18,671 | 7,317,755 | 116,716,292 |
| HOUSEHOLDS, HOUSEHOLD TYPE | |||
| Family households: Map | 11,489 | 4,649,791 | 77,538,296 |
| Husband-wife family Map | 8,414 | 3,192,903 | 56,510,377 |
| Other family: Map | 3,075 | 1,456,888 | 21,027,919 |
| Male householder, no wife present Map | 1,043 | 366,948 | 5,777,570 |
| Female householder, no husband present Map | 2,032 | 1,089,940 | 15,250,349 |
| Nonfamily households: Map | 7,182 | 2,667,964 | 39,177,996 |
| Householder living alone Map | 5,220 | 2,130,670 | 31,204,909 |
| Householder not living alone Map | 1,962 | 537,294 | 7,973,087 |
| HOUSEHOLDS, HISPANIC OR LATINO ORIGIN OF HOUSEHOLDER | |||
| Not Hispanic or Latino householder: Map | 18,400 | 6,311,241 | 103,254,926 |
| Hispanic or Latino householder: Map | 271 | 1,006,514 | 13,461,366 |
| HOUSEHOLDS, RACE OF HOUSEHOLDER | |||
| Householder who is White alone | 18,016 | 5,169,163 | 89,754,352 |
| Householder who is Black or African American alone | 236 | 1,095,790 | 14,129,983 |
| Householder who is American Indian and Alaska Native alone | 56 | 33,824 | 939,707 |
| Householder who is Asian alone | 116 | 445,652 | 4,632,164 |
| Householder who is Native Hawaiian and Other Pacific Islander alone | 2 | 2,615 | 143,932 |
| Householder who is Some Other Race alone | 64 | 405,320 | 4,916,427 |
| Householder who is Two or More Races | 181 | 165,391 | 2,199,727 |
| HOUSEHOLDS, HOUSEHOLD TYPE BY HOUSEHOLD SIZE | |||
| Family households: Map | 11,489 | 4,649,791 | 77,538,296 |
| 2-person household Map | 5,062 | 1,785,206 | 31,882,616 |
| 3-person household Map | 2,674 | 1,109,716 | 17,765,829 |
| 4-person household Map | 2,284 | 944,590 | 15,214,075 |
| 5-person household Map | 928 | 461,667 | 7,411,997 |
| 6-person household Map | 360 | 189,577 | 3,026,278 |
| 7-or-more-person household Map | 181 | 159,035 | 2,237,501 |
| Nonfamily households: Map | 7,182 | 2,667,964 | 39,177,996 |
| 1-person household Map | 5,220 | 2,130,670 | 31,204,909 |
| 2-person household Map | 1,376 | 430,564 | 6,360,012 |
| 3-person household Map | 299 | 66,787 | 992,156 |
| 4-person household Map | 146 | 24,877 | 411,171 |
| 5-person household Map | 73 | 8,596 | 126,634 |
| 6-person household Map | 41 | 3,400 | 48,421 |
| 7-or-more-person household Map | 27 | 3,070 | 34,693 |
| HOUSING UNITS | |||
| Total Housing Units Map | 20,577 | 8,108,103 | 131,704,730 |
| HOUSING UNITS, OCCUPANCY STATUS | |||
| Occupied Map | 18,671 | 7,317,755 | 116,716,292 |
| Vacant Map | 1,906 | 790,348 | 14,988,438 |
| HOUSING UNITS, OCCUPIED, TENURE | |||
| Owned with a mortgage or a loan Map | 7,675 | 2,610,123 | 52,979,430 |
| Owned free and clear Map | 4,446 | 1,287,714 | 23,006,644 |
| Renter occupied Map | 6,550 | 3,419,918 | 40,730,218 |
| HOUSING UNITS, VACANT, VACANCY STATUS | |||
| For rent Map | 339 | 200,039 | 4,137,567 |
| Rented, not occupied Map | 31 | 12,786 | 206,825 |
| For sale only Map | 171 | 77,225 | 1,896,796 |
| Sold, not occupied Map | 53 | 21,027 | 421,032 |
| For seasonal, recreational, or occasional use Map | 776 | 289,301 | 4,649,298 |
| For migrant workers Map | 0 | 892 | 24,161 |
| Other vacant Map | 536 | 189,078 | 3,652,759 |
| HOUSING UNITS, OCCUPIED, AVERAGE HOUSEHOLD SIZE BY TENURE | |||
| Total: Map | 2.45 | 2.57 | 2.58 |
| Owner occupied Map | 2.56 | 2.71 | 2.65 |
| Renter occupied Map | 2.26 | 2.41 | 2.44 |
| HOUSING UNITS, OCCUPIED, TENURE BY RACE OF HOUSEHOLDER | |||
| Owner occupied: Map | 12,121 | 3,897,837 | 75,986,074 |
| Householder who is White alone Map | 11,884 | 3,237,592 | 63,446,275 |
| Householder who is Black or African American alone Map | 64 | 325,395 | 6,261,464 |
| Householder who is American Indian and Alaska Native alone Map | 25 | 11,250 | 509,588 |
| Householder who is Asian alone Map | 62 | 197,011 | 2,688,861 |
| Householder who is Native Hawaiian and Other Pacific Islander alone Map | 0 | 741 | 61,911 |
| Householder who is Some Other Race alone Map | 16 | 74,243 | 1,975,817 |
| Householder who is Two or More Races Map | 70 | 51,605 | 1,042,158 |
| Renter occupied: Map | 6,550 | 3,419,918 | 40,730,218 |
| Householder who is White alone Map | 6,132 | 1,931,571 | 26,308,077 |
| Householder who is Black or African American alone Map | 172 | 770,395 | 7,868,519 |
| Householder who is American Indian and Alaska Native alone Map | 31 | 22,574 | 430,119 |
| Householder who is Asian alone Map | 54 | 248,641 | 1,943,303 |
| Householder who is Native Hawaiian and Other Pacific Islander alone Map | 2 | 1,874 | 82,021 |
| Householder who is Some Other Race alone Map | 48 | 331,077 | 2,940,610 |
| Householder who is Two or More Races Map | 111 | 113,786 | 1,157,569 |
| HOUSING UNITS, OCCUPIED, TENURE BY HISPANIC OR LATINO ORIGIN OF HOUSEHOLDER | |||
| Owner occupied: Map | 12,121 | 3,897,837 | 75,986,074 |
| Not Hispanic or Latino householder Map | 12,015 | 3,664,784 | 69,617,625 |
| Hispanic or Latino householder Map | 106 | 233,053 | 6,368,449 |
| Renter occupied: Map | 6,550 | 3,419,918 | 40,730,218 |
| Not Hispanic or Latino householder Map | 6,385 | 2,646,457 | 33,637,301 |
| Hispanic or Latino householder Map | 165 | 773,461 | 7,092,917 |
| HOUSING UNITS, OCCUPIED, TENURE BY HOUSEHOLD SIZE | |||
| Owner occupied: Map | 12,121 | 3,897,837 | 75,986,074 |
| 1-person household Map | 2,562 | 860,611 | 16,453,569 |
| 2-person household Map | 4,748 | 1,304,752 | 27,618,605 |
| 3-person household Map | 2,010 | 660,251 | 12,517,563 |
| 4-person household Map | 1,738 | 606,580 | 10,998,793 |
| 5-person household Map | 679 | 279,929 | 5,057,765 |
| 6-person household Map | 259 | 106,323 | 1,965,796 |
| 7-or-more-person household Map | 125 | 79,391 | 1,373,983 |
| Renter occupied: Map | 6,550 | 3,419,918 | 40,730,218 |
| 1-person household Map | 2,658 | 1,270,059 | 14,751,340 |
| 2-person household Map | 1,690 | 911,018 | 10,624,023 |
| 3-person household Map | 963 | 516,252 | 6,240,422 |
| 4-person household Map | 692 | 362,887 | 4,626,453 |
| 5-person household Map | 322 | 190,334 | 2,480,866 |
| 6-person household Map | 142 | 86,654 | 1,108,903 |
| 7-or-more-person household Map | 83 | 82,714 | 898,211 |
Loading...